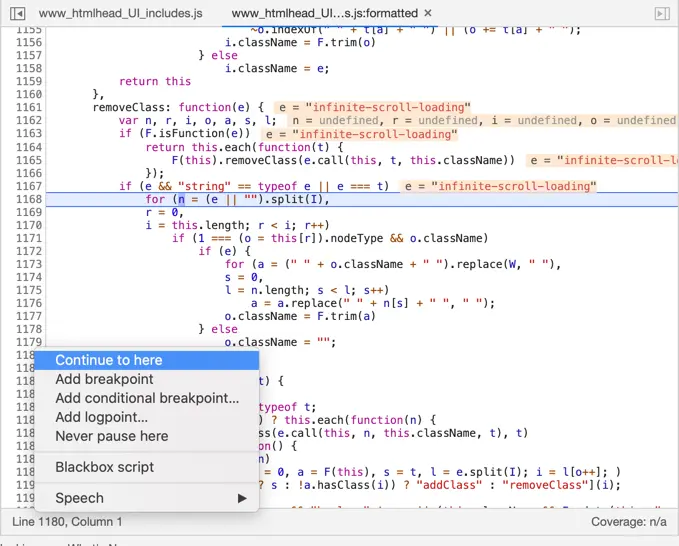
Inside the Chrome debugger, there's a simple way to advance the flow of your debugging scope.

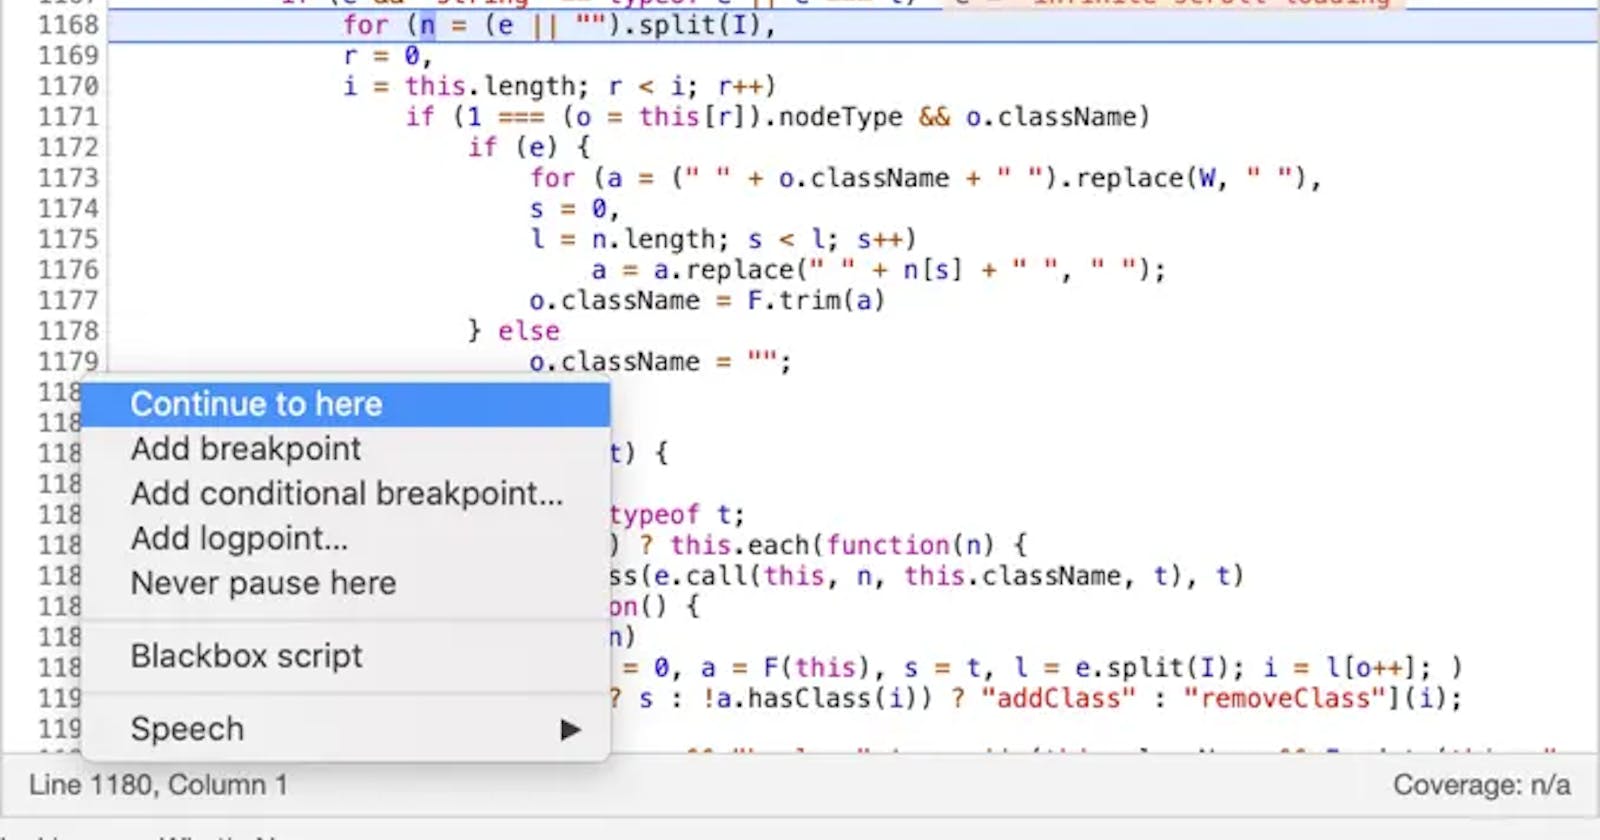
Above, we see we've paused execution on line 1168. If we want to inspect the flow up to another point we can simply right click on the line we want and click "Continue to here."
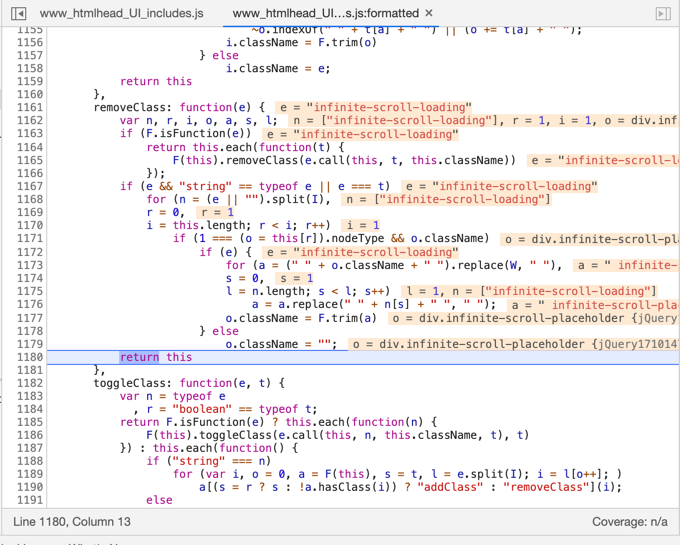
 And bam! We've advanced to the target spot in code! 🧙♂️
Check out more #JSBits at my blog, jsbits-yo.com. Or follow me on Twitter!

